
Why Your House Isn’t Selling — And the Exact Move That Changes Everything
If your Central Florida home has been sitting for 45+ days, you’ve entered the MLS algorithm trap. Here’s a data-driven diagnosis and the strategic pivot that gets buyers back through your door.
📞 Free Market Drift Analysis Book Strategy CallYou listed your home. You cleaned it up. You moved out or staged it. And then you waited. And waited. And the showing requests slowed down. The phone got quiet. And now you’re wondering: what is wrong with my house?
Here’s the hard truth, delivered with care: in 99% of cases, nothing is wrong with your house. The price is wrong.
And in 2026’s Central Florida market — where buyers have genuine alternatives, where mortgage rates have kept monthly payments high, and where the “fear of missing out” buying frenzy has cooled — a home that’s priced even 3–5% above market can sit for months while identical homes at accurate prices go under contract in weeks.
This isn’t failure. It’s information. And with the right pivot, you can still get a strong outcome. But the window to act is narrower than most sellers realize.
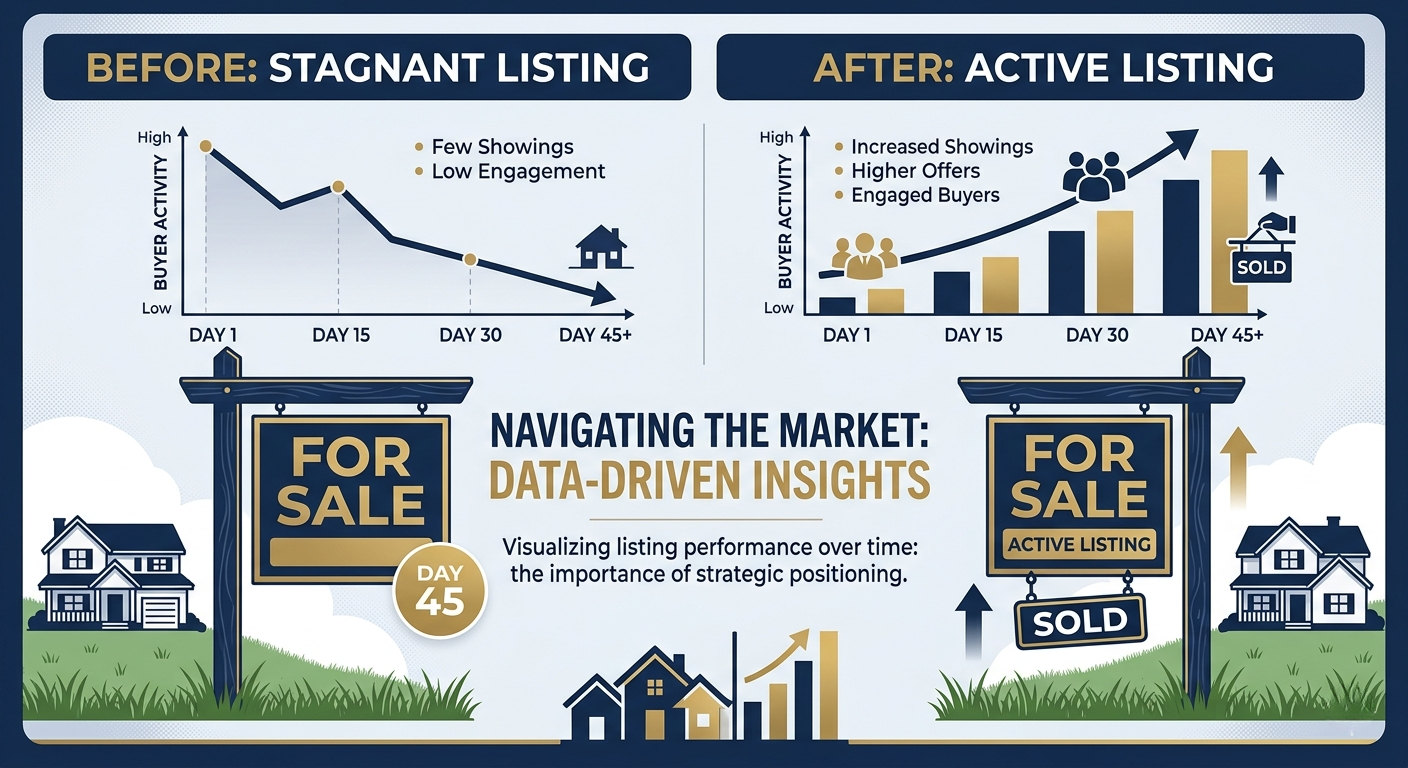
The Anatomy of a Stagnant Listing
Let me show you what’s actually happening behind the scenes when a home sits on the MLS.
Days 1–14: The Launch Window
When a listing goes live, it gets an automatic surge of attention. Buyers who’ve been saved on a home search get alerts. Buyer agents who have clients in that price range and location show their clients. The platform algorithms surface your listing as “new.” This is your highest-opportunity period — and it’s finite.
Days 15–30: The Feedback Signal
If you haven’t gone under contract, the market is telling you something. Common feedback patterns at this stage: “Love the home, thought the price was a bit high.” “We found a similar home that’s already had a price reduction.” “We offered $X elsewhere.” This feedback is gold — if your agent is actually collecting it and sharing it.
Days 31–45: The Algorithm Shift
Here’s what most homeowners don’t know: apps like Zillow, Realtor.com, and Homes.com use engagement data to surface listings. A home that generates showings and saves but no offers gets flagged as low-conversion. It starts to appear lower in search results. New buyers browsing the market may not even see it on the first page.
Day 45+: The Stigma
Buyers who do find your listing look at the days-on-market number. In a 2026 balanced market where the average is 58–71 days, a home at 60+ days isn’t normal — it’s a red flag. The question buyers ask is: “If no one else has bought it, why would I?” They start to assume there’s something wrong — even if there isn’t.
- Few or no showings after Day 10
- Showings but no offers or feedback says “too high”
- Comparable homes going under contract while yours sits
- Your Zestimate has dropped below your list price
- You priced based on 2024 comps or active (not sold) listings
- You received one low offer and rejected it without countering
- 5–10 showings in first two weeks
- Buyers asking about offers, not conditions
- Priced within 1–2% of last 90 days’ sold comps
- Clean inspection report ready to share
- Proactive buyer incentive offered (buydown or credit)
- Professional photography, 3D tour, digital floor plan
Data Over Emotion: How to Actually Read the Market
The most common pricing mistake I see in 2026 is sellers comparing their home to what homes sold for in 2022 or 2023 — or worse, to active listings that haven’t sold either.
Here’s the only data that matters for pricing your home right now:
- Sold comparables within the last 90 days — not 6 months, not 12. The market has moved. Use recent data.
- Homes of similar size, condition, and features — not what you wish your home was comparable to
- Price per square foot for your specific subdivision — neighborhood micro-markets vary widely in Central Florida
- Days on market for sold comps — if similar homes sold in 25 days, that’s the speed benchmark. If in 65 days, that’s the new normal for your area.
The Strategic Pricing Pivot: The Micro-Adjustment Method
If you’re sitting at 45+ days without an offer, here’s the playbook I recommend to my sellers:
Step 1: The 2–3% Micro-Adjustment
A price reduction of 2–3% signals to buyers and their agents that the seller is motivated — without signaling desperation. At $400,000, that’s an $8,000–$12,000 reduction. But this alone isn’t enough. You need to pair it with something that creates urgency.
Step 2: Add a Buyer Incentive Simultaneously
When you announce the price adjustment, simultaneously offer a buyer incentive — either a closing cost credit or a temporary rate buydown. This does two things: it gives agents a new talking point when they present your listing to buyers, and it provides buyers with immediate, tangible value that they can quantify.
Step 3: Refresh the Marketing
New photos. A new hero shot. Updated listing description language. On some platforms, a price adjustment actually resets your “new listing” visibility — but only if the marketing around it is compelling. A price drop with the same stale photos is a missed opportunity.
Step 4: The 72-Hour Blitz
Have your agent contact the 10–15 buyer agents who showed the home without offers and personally alert them to the adjustment and the new incentive. A personal call from agent to agent at this stage has closed more deals than any MLS update.
📊 Strategic Pricing Pivot Calculator
Model two scenarios side by side: staying at current price vs. a strategic 2–3% adjustment plus buyer incentive. See the estimated net difference.
The Right Comps: Why 90 Days Is Your Only Window
Let me show you exactly what the 90-day comp window looks like in practice for Central Florida submarkets:
| Data Source | Reliability for 2026 Pricing | Why |
|---|---|---|
| Active listings (homes currently for sale) | ❌ Unreliable | These are your competition, not your market price. They haven’t sold yet. |
| Sold homes 12–18 months ago | ❌ Misleading | Market has shifted significantly. These prices are no longer achievable in most cases. |
| Sold homes 91–180 days ago | ⚠️ Use with caution | Directionally helpful but may need a trend adjustment downward |
| Sold homes 1–90 days ago, same subdivision | ✅ Primary data | Most accurate reflection of what buyers are actually paying right now |
| Pending contracts (under contract, not yet closed) | ✅ Forward-looking | Shows current buyer sentiment — where the market is heading |
Request a Confidential Market Drift Analysis
I’ll pull the most recent sold data for your specific subdivision, compare it to your current position, and tell you exactly what adjustment — if any — makes financial sense. No pressure. Just data.
📞 407-603-1664 — Get the AnalysisFrequently Asked Questions
Your Home Can Still Sell — With the Right Strategy
I’ve helped homeowners navigate stagnant listings in every type of market. The solution is almost never “wait it out.” It’s a precise, data-driven pivot executed at the right moment. Let’s look at your numbers.
📞 Free Consultation: 407-603-1664